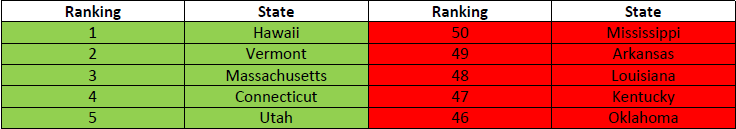
On December 10, 2014, the United Health Foundation in partnership with the American Public Health Association and Partnership for Prevention released America’s Health Rankings: A Call to Action for Individuals and their Communities. This year marks the 25th anniversary of the Report, which annually assesses the health of the fifty United States. The top and bottom five states are presented in the table below:

Over the 25 years, metrics used to collect data have remained largely consistent, allowing for longitudinal comparisons. The greatest advances in health are in declines in smoking and infant mortality and increases in adolescent immunizations. Nonetheless, health improvements are offset by rising levels of obesity and physical inactivity.
Obesity is a leading contributor to death in the US, and has more than doubled from 11.6% in 1990 to 29.4% in 2014. Cigarette smoking is the leading cause of preventable death in the country, though figures are lower than 25 years ago (29.5% in 1990 and 19.0% in 2014). Average life expectancy is at a record high at 78.8 years.
In addition, since the rankings started in 1990, 32 states have decreased premature death 10% or more. However, premature death has also increased by 10% in Oklahoma and West Virginia, highlighting the fact that health gains are not experienced equally across states or population groups in the US.
Last year, the Vitality Institute released an infographic with findings from Vitality Age, an interactive risk score based on an algorithm reflecting lifestyle-related modifiable risk factors for cardio-metabolic disease for which there is substantive evidence demonstrating a dose-response relationship between levels of risk and disease. The results presented in Americas Health Rankings Report align with our Vitality Age analysis: Americans are 5 years older than they think. Will Americans will be five years younger than they think in 2050?

How does your state rank? Do you know about any initiatives to improve health in your state? We want to hear from you! Leave a comment below or tweet at the Vitality Institute @VitalityInst, Elle Alexander @ElleGHAP or Gillian Christie @gchristie34